Who this is for
Whoever has to defend marketing or ops spend in a room, and is currently doing it with numbers pulled from three different tools.
What's included
- Attribution across paid, organic and referral
- Agent and channel performance views
- Scheduled digests to leadership
Inside the dashboard
Illustrative preview — not client data- Paid · 38%
- Organic · 27%
- Referral · 20%
- Direct · 15%
1 view
source to closed deal
Weekly
leadership digest
Where we've done this

Questions about this service
What does a real example look like?
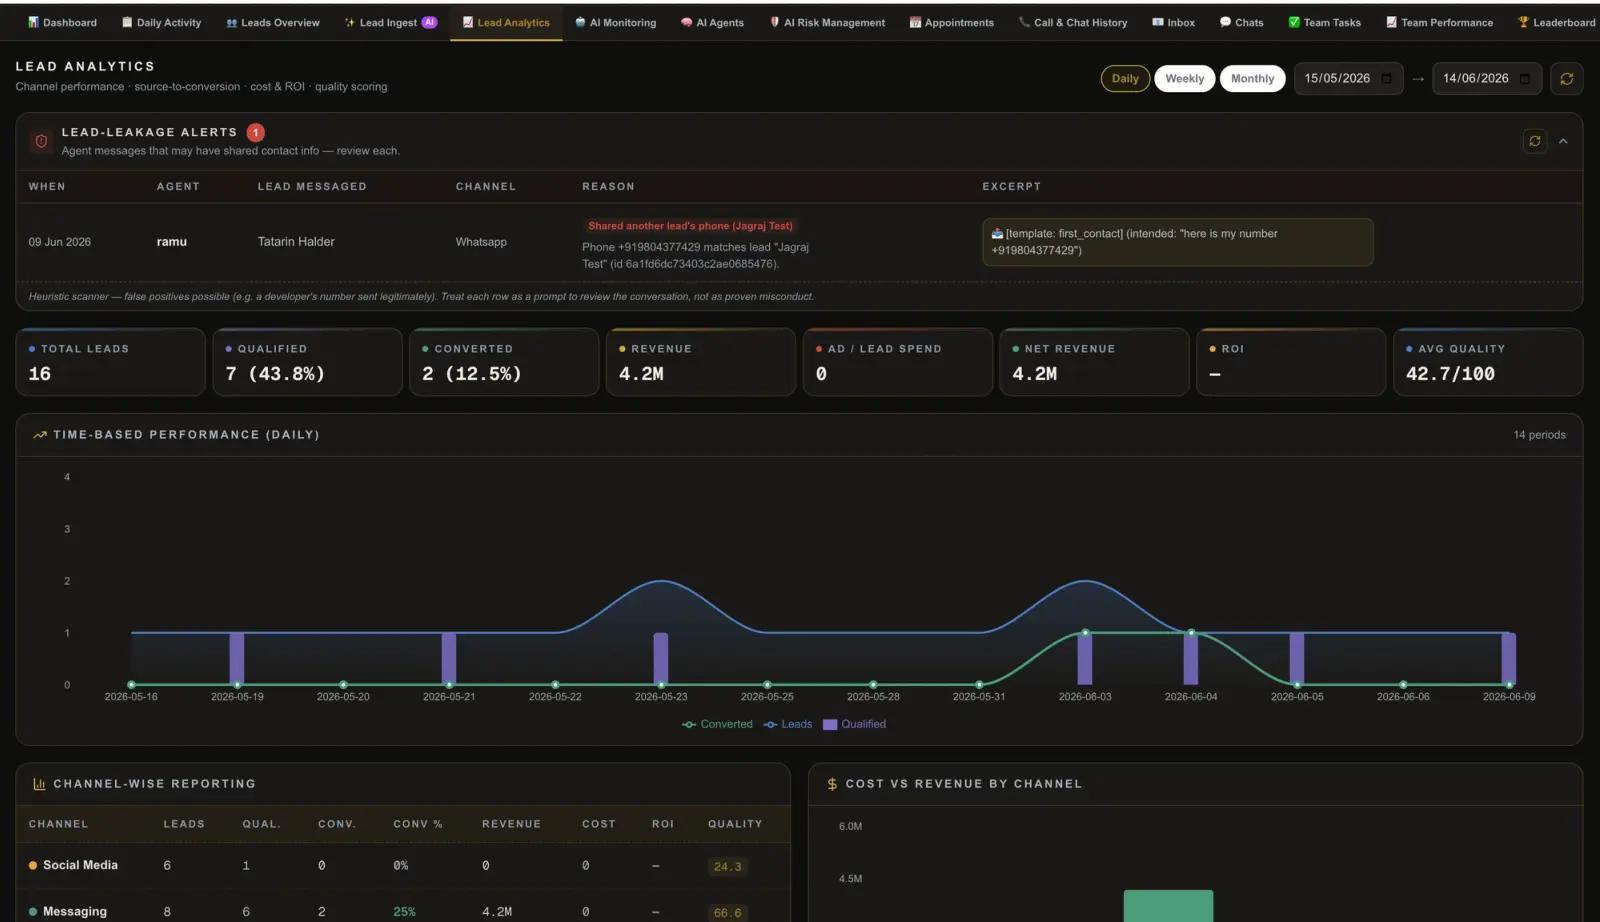
Asobr's Lead Analytics dashboard breaks down leads, deals, conversion rate and quality score per channel, flags lead-leakage incidents automatically, and tracks cost vs revenue by channel.
Can it detect problems, not just report numbers?
Yes — the same dashboard can carry AI-powered quality scoring and automated alerts (Asobr's flags agents sharing contact details off-platform), not just static charts.
Who ends up using it day to day?
Usually both — a leadership view for budget conversations, and an operational view for whoever's managing channels day to day.